In 2019, I took a look at every top-16 rookie (by ADP) in the 2014-2018 drafts in an effort to determine the value of a 1st round draft pick. This year, I re-examined all 80 players from the first article and added 48 more from the 2019-2021 drafts to finally settle just what you should expect from a top 16 pick.
Pre-Context:
I chose to re-tread this topic for two reasons:
- There’s an extra 48 players worth of data that has come out since the first edition.
- I was curious if the fantasy community has gotten better at projecting rookies since 2019.
I imagine I’ll be back here, doing the same thing for a third time, circa 2027. There’s no way I’d rather spend my thirties.
You don’t need to have read the original issue of this article from 2019 since we’ll be re-evaluating the same 80 rookies from before. But if you’d like to view it, you can do so here.
We’ll be grading rookies on a 5 point scale from Total Bust to Grand Slam. This scale is not a bell curve. The scale represents different levels of production. Production is not a Gaussian distribution. Example: Rookies are more likely to be total busts than to have one good season and dip; WRs are just as likely to end up a WR2 as they are a WR3.
| Grade | Grade Name | Description | Examples |
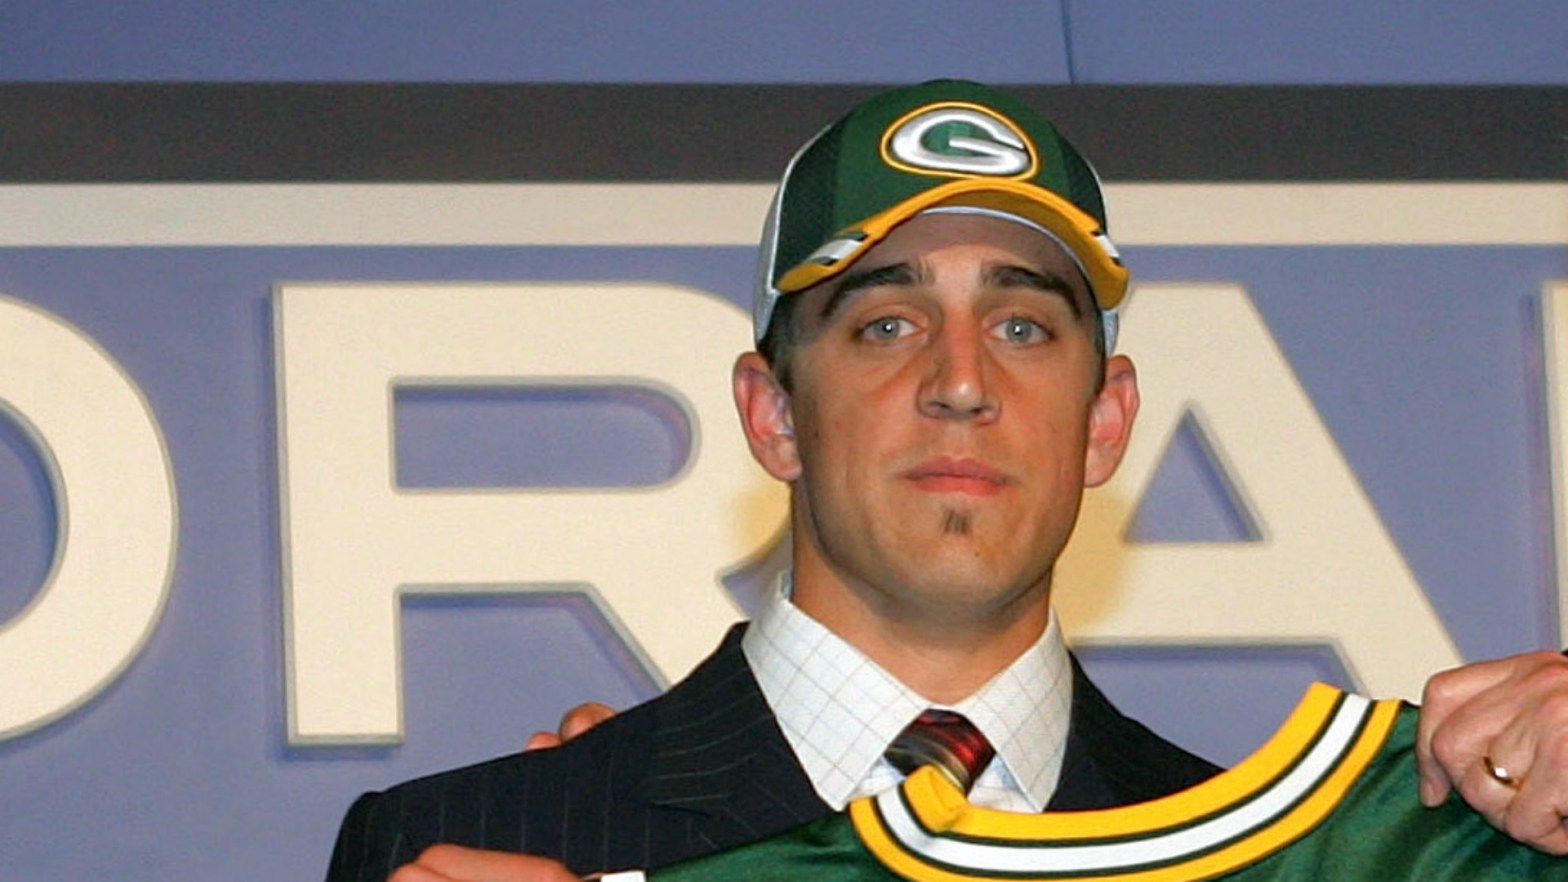
| 5 | Grand Slam | A player who, within their rookie contract, becomes a foundational player to your fantasy team. These are your RB1s, WR1s, QB½s, and TE½s. | Justin Jefferson; Jonathan Taylor |
| 4 | Strong Hit | A player who is a reliable fantasy starter. These players provide multiple seasons where they’re regulars in your lineup. | Daniel Jones; D.J. Moore; Miles Sanders |
| 3 | Weak Hit | Usually a player who is a regular flex option. They may not have any time as a top option at their position, but they provide much needed roster depth. Alternatively, it may refer to a player who had an impressive season, but was otherwise a disappointment. | Cam Akers; Diontae Johnson; D.J. Chark |
| 2 | Mostly Bust | A player who is not fantasy relevant for most their career, but may have had a season as a flex option; or may become an important handcuff. | Samaje Perine; Kerryon Johnson; Will Fuller |
| 1 | Total Bust | A player who fails to ever be fantasy relevant. Likely out of the league before their rookie contract expires. | N’Keal Harry; Bishop Sankey |
Eight Years of First Round Picks
Out of 128 rookies drafted from 2014 – 2021, here’s how they were graded:
- Grand Slam: 13.28% (-6.72 | 34% Decr.)
- Strong Hit: 25% (+2.5 | 11% Incr.)
- Weak Hit: 24.22% (+1.72 | 8% Incr.)
- Mostly Bust: 10.16% (-3.59 | 26% Decr.)
- Total Bust: 27.34% (+6.09 | 29% Incr.)
The parentheticals provide changes as compared the percentages I gave in 2019.
So what’s up with the lower grand slam and increased total bust rates? Have rookies gotten worse? No. I was more discerning this time giving out “Grand Slam” grades. I gave 16 players from 2014 – 2018 a top grade last time, versus 10 players from the same time period this time. This is primarily due to us having several extra years worth of data from players I previously graded a 5 that showed they were more like 4’s.
If we compare the hit percentages from just the new 48 players (2019 – 2021) to what the percentages should have been for the previous 80 (2014-2018), here’s what we get:
- Grand Slam: 14.58% (+2.08 | 17% Increase)
- Strong Hit: 37.50% (+20.00 | 114% Increase)
- Weak Hit: 14.58% (-15.42 | 51% Decrease)
- Mostly Bust: 4.17% (-9.58 | 70% Decrease)
- Total Bust: 29.17% (+2.92 | 11% Increase)
The sample size is smaller than I’d like, but we can draw a couple tentative preliminary conclusions from this data:
- The grand slam rate is much lower than what was originally given in 2019, and the total bust rate is much higher than what was originally given in 2019.
- The rookies from 2019 – 2021 have been better in quality than years before. Or maybe analysts have gotten better at projecting players.
A Closer Look
In 2019, I concluded that the top 8 have a statistically significantly higher chance of becoming a long term startable player compared to the bottom 8. Let’s see if that trend holds this time around.
| Grade | 1.01 – 1.08 | [1.03 – 1.08] | 1.09 – 1.16 |
|---|---|---|---|
| Grand Slam | 23.44% | 14.58% | 3.13% |
| Strong Hit | 29.69% | 31.25% | 20.31% |
| Weak Hit | 25.00% | 31.25% | 23.44% |
| Mostly Bust | 3.13% | 4.17% | 17.19% |
| Total Bust | 18.75% | 18.75% | 35.94% |
Your hit rate drops from 78% to 47% if you are drafting in the second half of the first round. Your bust rate rises from 22% to 53%. To say a top half pick is more valuable would be an understatement.
Previously, I further narrowed our results to the top four each year – so let’s do that again.
| Grade | 1.01 – 1.04 | [1.03 – 1.04] | 1.05 – 1.08 |
|---|---|---|---|
| Grand Slam | 28.13% | 6.25% | 18.75% |
| Strong Hit | 28.13% | 37.50% | 28.13% |
| Weak Hit | 21.88% | 31.25% | 31.25% |
| Mostly Bust | 0.00% | 0.00% | 6.25% |
| Total Bust | 21.88% | 25.00% | 15.63% |
This might give us the most important insight of the article. In 2019, there was an 11% chance higher of a hit on a top 4 versus a top 8 pick – including a 60% higher chance of a grand slam.
But the extra years have given us data to support the conclusion that a top 4 and top 8 pick have the exact same hit/bust rate. The only difference is the slightly better chance to hit a grand slam in the top 4.
Even more surprising, picks 1.05 – 1.08 actually outperform 1.03 – 1.04. Without further research, I can not provided a substantiated theory as to why this is. Likely, 1.03 – 1.08 are all equally valuable and 1.03 – 1.04 have just been unlucky.
Finally, let’s look at 1.01 and 1.02.
| Grade | 1.01 | 1.02 |
|---|---|---|
| Grand Slam | 50% | 50% |
| Strong Hit | 25% | 12.5% |
| Weak Hit | 25% | 0% |
| Mostly Bust | 0% | 0% |
| Total Bust | 0% | 37.5% |
The 1.01 and 1.02 have an equal grand slam rate – which is very high; but the 1.02 comes with a substantial bust potential.
A List of Important Conclusions:
- An average 1st round pick has a 62.5% chance of hitting and a 37.5% of busting.
- Your chance of getting a cornerstone grand slam player is 50% with a top 2 pick; 28% with a top 4 pick; 23% with a top 8 pick; and 3% with a bottom 8 pick.
- Your chance of busting is 22% with a top 8 pick and 53% with a bottom 8 pick.
- Don’t split hairs between picks 1.03 and 1.08.
- The grand slam rate for the 1.01 and 1.02 are equal – but the 1.02 can bust.
Let’s Get to the Fucking Value
Is a top player worth trading for a first round pick? Clearly not. On average, it would take 5 first round picks to have a 50% chance of getting another top end dynasty asset. Obviously though, this number can change depending on the exact pick. The 1.01 is nearly worth a top asset on it’s own. Whereas it would probably take at least 6 late firsts to match the value of Justin Jefferson.
Is a WR2 or RB2 worth trading for a first round pick? Not for just any pick. It’d take two 1sts on average to replace them. But if you can get a top 2 pick it may be worth it for the grand slam chance. The 1.01 is certainly worth giving up a second tier skill player for.
Is a flex player worth trading for a first round pick? Yes. On average you will replace them or upgrade them with a younger player.
How much is a 1.01 worth compared to a other picks? I’ll cut to the chase. In my opinion: 1.5x 1.02; 2x 1.03-1.08; 4x 1.09-1.16. These values will obviously vary subjectively by strategy and a GM’s risk profile.
Is the 1.01 really worth 4 picks from 1.09-1.16? In my opinion, yes. Let’s say you had the 1.01 and were offered the 1.09, 1.10, 1.11, and 1.12 for it. Historically, the 1.01 is a grand slam 50% of the time, and is a weak hit or better 100% of the time. The four later picks will, on average, produce one strong hit, one weak hit, and two busts.
How much is a top 8 worth compared to a bottom 8 pick? I think it is fair to value a top half pick at two bottom half picks. In a two-for-one trade, the single pick in the top half side gets a substantial chance at a grand slam player. In exchange, the double pick on the bottom half side gets a chance at multiple fantasy relevant players.
| Top 8 | Bottom 8 | |
| Number of Picks Needed for Hit | 1.28 | 2.13 |
| Number of Picks Needed for Grand Slam | 4.27 | 31.95 |
Here’s a quick chart comparing my conclusions this time to 2019.
| The Value Of.. | 2019 Projected Value | 2023 Projected Value |
|---|---|---|
| Top 30 Player | 3 Mid 1sts | 1-2 Early 1sts 3 Mid 1sts 4-6 Late 1sts |
| WR2; RB2; Good QB; Good TE | 2 Mid 1sts | 1 Early 1st 2 Mid 1sts 2-3 Late 1sts |
| Flex Player | 1 Mid 1st | 1 Mid 1st 1 Late 1st |
| 1.01 – 1.02 | N/A | 2 Mid 1sts 4 Late 1sts |
| 1.03 – 1.08 | N/A | 2 Late 1sts |
Lastly
Thank you for reading. I hope this helps you assemble your future dream team. You can find all 128 players and what I graded them on this Google Sheet.
